
Creating charts and widgets
Charts show your CRM data visually, and text widgets add notes to explain it. You add both to a dashboard. To create and manage dashboards, see Creating and managing dashboards.
Add a chart
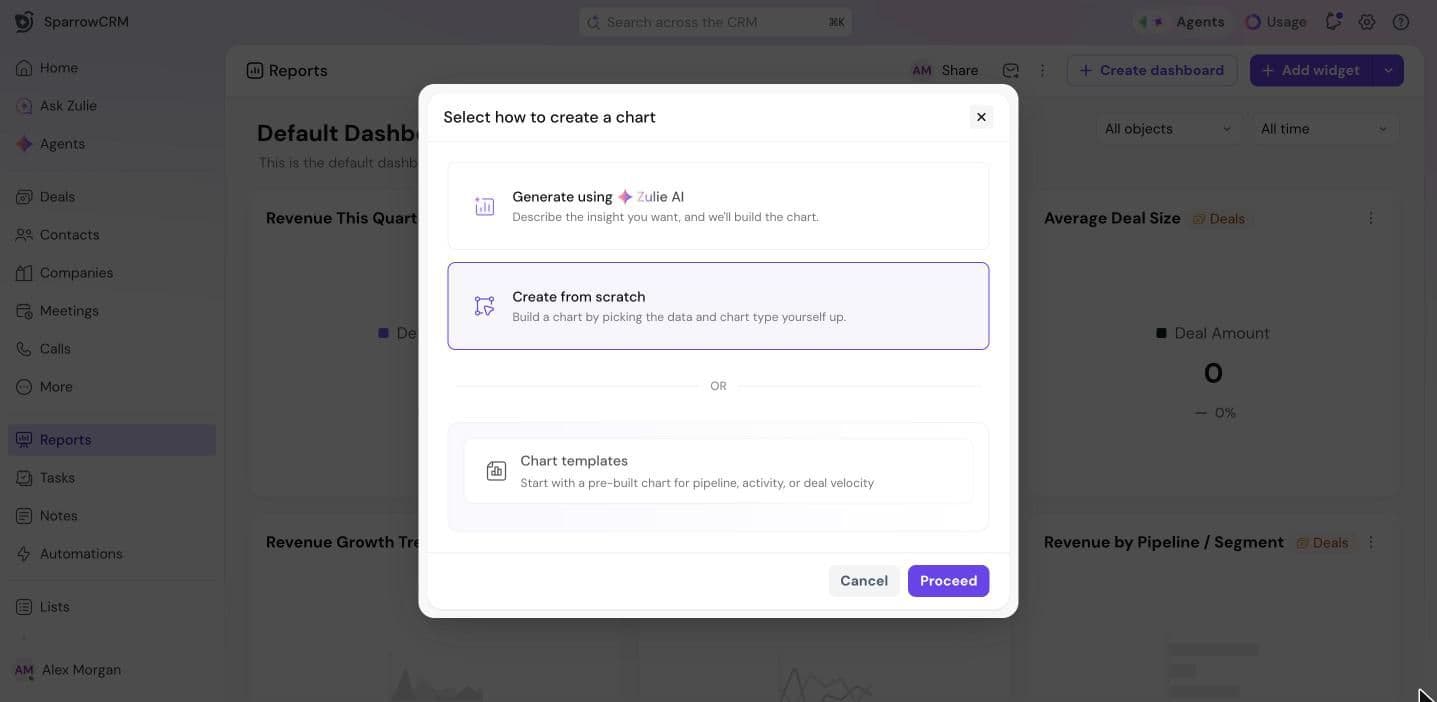
Open a dashboard and click Add widget. Choose how to create the chart, then click Proceed:
- Generate using Zulie AI: describe the insight you want, and Zulie builds the chart.
- Create from scratch: pick the data and chart type yourself.
- Chart templates: start with a pre-built chart for pipeline, activity or deal velocity.
Generate a chart with Zulie
- Under Describe your chart, write what you want to see, for example "How are deals distributed across owners and stages?". Or click one of the suggested prompts.
- Optionally, choose a Chart type and Data source.
- Click Generate, then Proceed to add the chart.
Build a chart from scratch
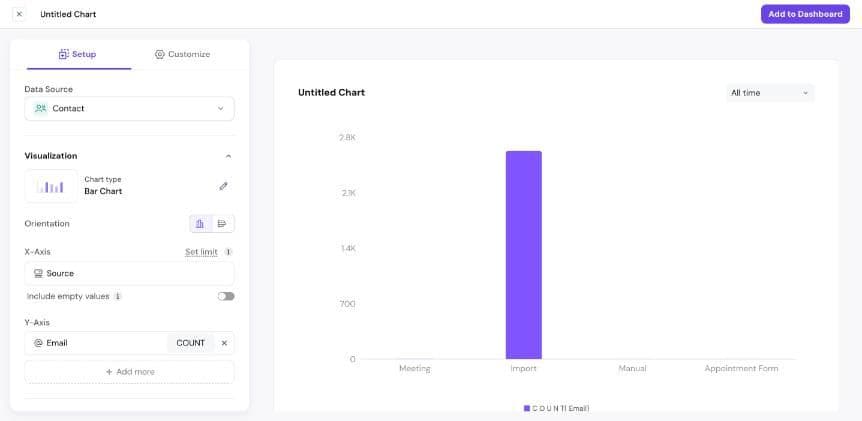
- Data Source: choose Contact, Company or Deal.
- Chart type: click the edit icon and pick a type (see below).
- Choose the fields to show. For a bar chart, pick a field for the X-Axis, like Source, and one for the Y-Axis, like Email to count contacts. Click Add more to compare more values.
- Optionally, use Stack by to split each bar by another field, Filter to include only some records, and Sort to set the order.
- Click the chart's name at the top to rename it.
- Click Add to Dashboard.
The preview updates as you build. On the X-axis, Set limit shows only the top results, and Include empty values shows records where the field is blank.
Chart types
- Bar Chart and Horizontal Bar: compare values across categories, like contacts by source.
- Line Chart and Area Chart: show a trend over time.
- Pie Chart and Donut Chart: show how a total is split.
- Funnel Chart: show how records move through stages.
- KPI Chart: show one key number.
- Gauge Chart: show one number against a target.
- Table: list records in rows and columns.
- Pivot Table: summarize values by rows and columns.
Customize the look
Open the Customize tab to choose a color Palette, show gridlines, values and the legend, set the legend position and stack type, add a target with Set target, and add axis labels and a chart description.
Check the data behind a chart
Below the preview, open Source data to see the records the chart is built from. Use it to check your numbers.
Add a text widget
Use a text widget to explain a dashboard, add context to a number or leave notes for your team.
- Click the arrow next to Add widget and choose Text widget.
- Add a title and your text. Use the toolbar to format it, add lists, links, images or emoji.
- Click Create Widget.
Need help?
Reach out to us at [email protected].
Was this helpful?